You can use the Researcher Dashboard to export data collected from data sources or activity responses. Every exportable data source supports CSV, and a few offer additional formats.
To export your data, open the Researcher Dashboard and navigate to the Data Export page:
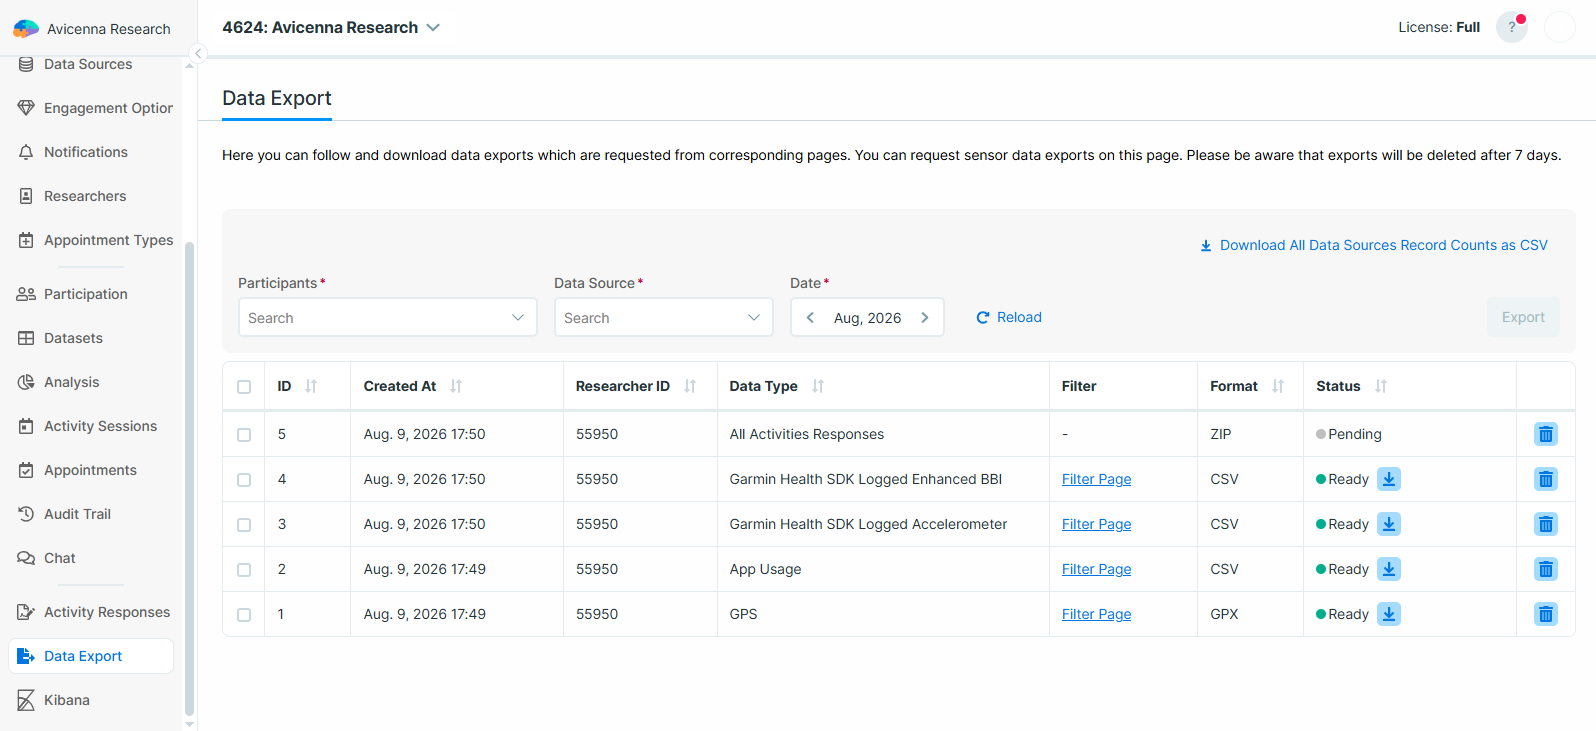
On the Data Export page:
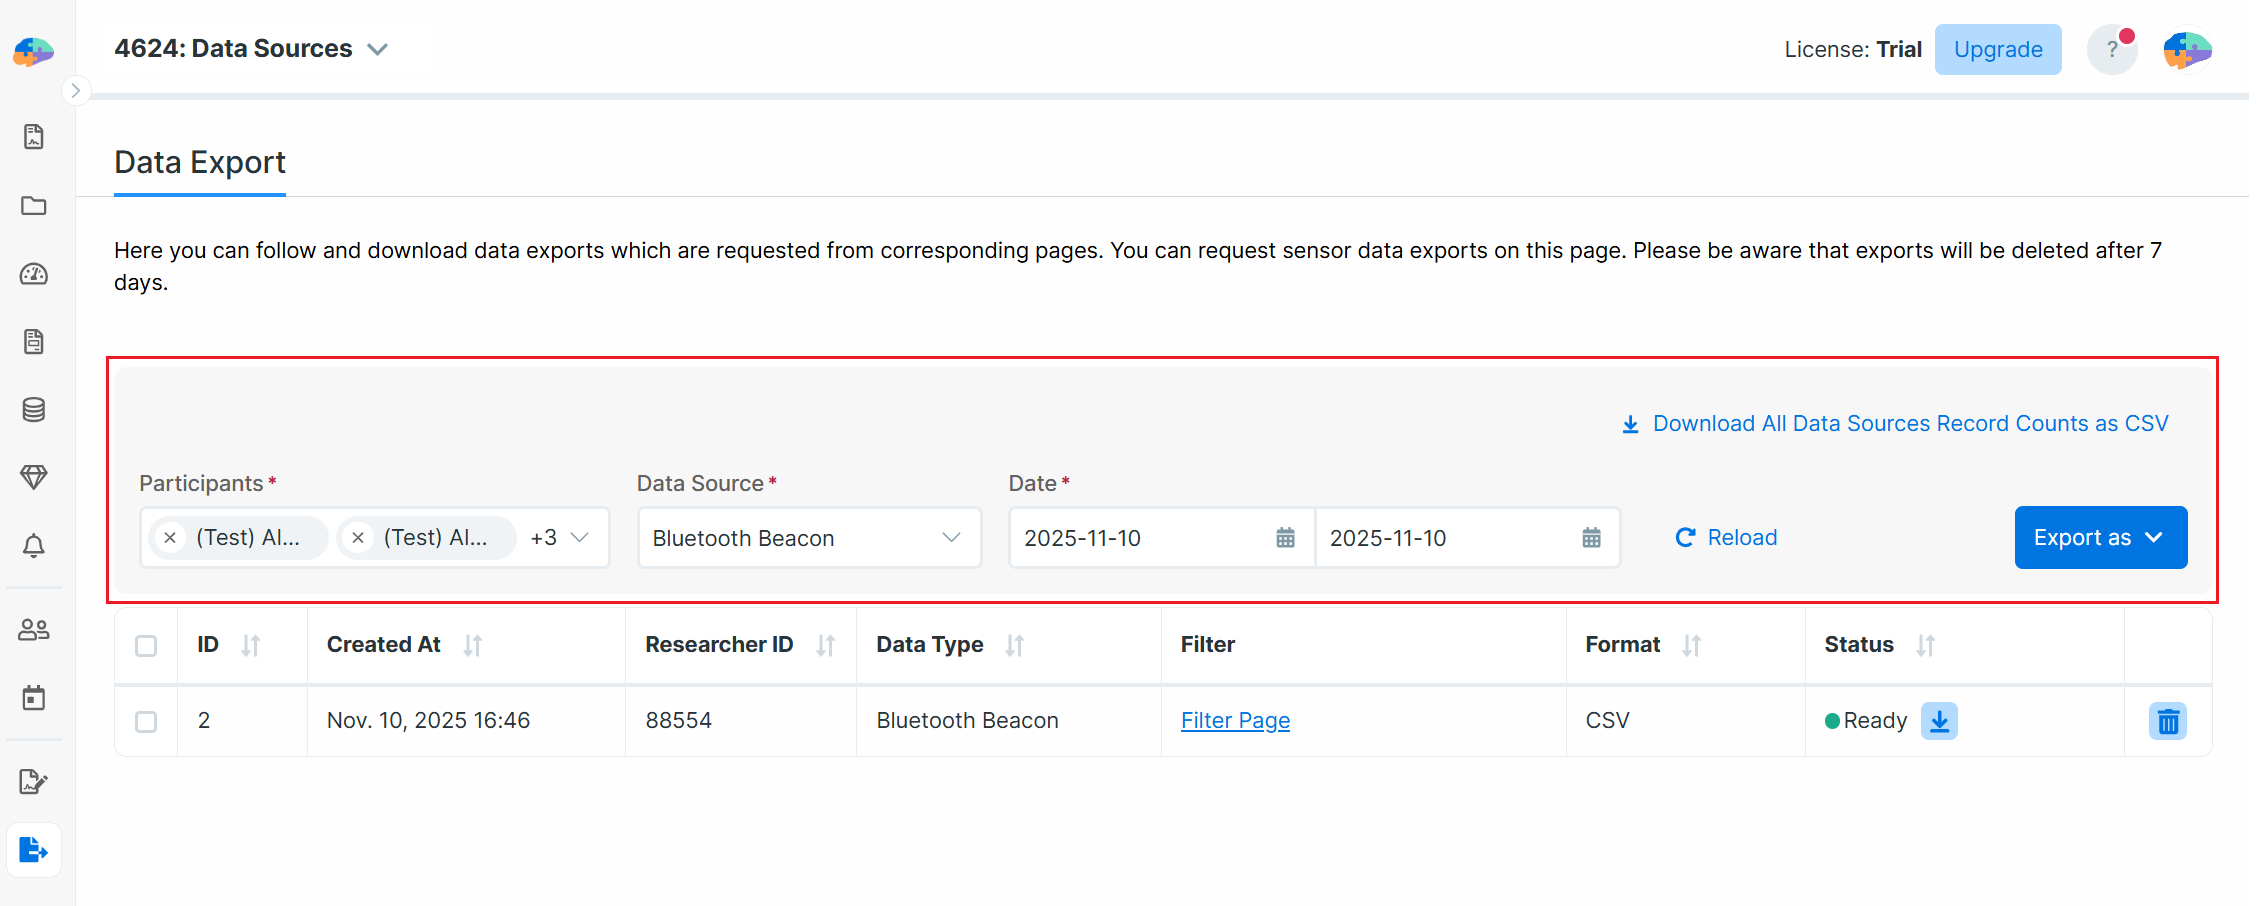
- Select the participants whose data you want to export.
- Choose the data source to export.
- Choose the date range for the data.
- Press Export as and select a format. If the data source supports only CSV, the button exports directly as CSV.
Depending on the size of the data, the export may take up to several hours. You can return to this page at any time to check the status of your export. When the file is ready, you will receive an email notification and can download it from the Data Export page.
Each export in the list shows one of the following statuses:
| Status | Meaning |
|---|---|
| Idle | The request has been created and is queued for processing. |
| Pending | Avicenna is currently generating the file. |
| Ready | The file is ready. Click the download arrow to retrieve it. |
| Failed | The export could not be completed. |
| Failed (Too Large) | The export exceeded the maximum size. Applies to data source exports only. See Export Size Limits. |
The downloaded file is always a ZIP archive containing one or more data files. Extract it before opening the data in your analysis tool.
[!note]
The Data Export page lists export requests of all types, including activity responses, all activity responses, sensor data, sessions, audit trail, notifications, and pending invitations. However, to export survey responses, you need to start the request from the Activity Responses page.
[!note]
Each export is available for download for up to 7 days. After that, Avicenna automatically deletes the file and removes it from the list. If you need the data again, you must create a new export.
Export Formats
Most data sources export as CSV only. The exceptions are:
| Data source | Available formats |
|---|---|
| GPS | CSV, KML, GPX |
| Bluetooth Beacon | CSV, GEXF |
Data Fields
The data fields included in each file depend on the type of data being exported. Please refer to the corresponding documents on our forum for details.
Export Size Limits
The limits in this section apply to data source exports only. Survey and activity response exports are not affected by them.
Avicenna splits each data source export into parts inside the ZIP archive. A single export can contain at most 50 parts of roughly 100 MB each, which puts the effective ceiling at about 5 GB of uncompressed data per export. When an export exceeds this, it stops and the status becomes Failed (Too Large).
Sensor data exports reach this limit easily, especially with a long date range or many participants. We recommend breaking large exports into multiple smaller requests. See My data export is taking too long or failing for a step-by-step approach.
A study can also hold a maximum of 100 data source exports at a time. If you reach this number, delete some of the older exports before creating a new one. Survey and activity response exports do not count toward this number.
Downloading Record Counts
You can download a file containing the count of collected records for each hour-long interval, grouped by data source for each participant. This provides a quick overview of the data collection volume across different data sources in your study.
To download the file, go to the Data Export page and click Download All Data Sources Record Counts as CSV. The download is a ZIP archive containing a single CSV file.
The CSV file includes the following columns:
| Column | Description |
|---|---|
data_source_id |
The unique identifier for the data source. See the Data Source ID Reference below. |
user_id |
The participant’s unique identifier. |
participation_type |
Main or Test, or Virtual for participants in a virtual cohort. Shows N/A if the participation type cannot be determined. |
device_id |
The unique identifier of the device that collected the data. |
time_bin |
The date and hour of the interval, in UTC, formatted as YYYY-MM-DD HH. |
count |
The number of records collected for that data source during that hour. |
The file covers every participant in the study except those whose registration is still pending.
Data Source ID Reference
The following table maps the data_source_id values to the data sources you can add to a study:
| ID | Data Source |
|---|---|
| 1 | Accelerometer |
| 2 | Ambient Temperature |
| 3 | Gyroscope |
| 4 | Gravity |
| 5 | Light |
| 6 | Linear Acceleration |
| 7 | Magnetic Field |
| 8 | Orientation |
| 9 | Pressure |
| 10 | Proximity |
| 11 | Relative Humidity |
| 13 | WiFi |
| 14 | Bluetooth |
| 15 | GPS |
| 16 | Battery |
| 20 | App Usage (Legacy) |
| 24 | Screen State |
| 25 | Pedometer |
| 26 | Activity Recognition |
| 27 | Bluetooth Beacon |
| 30 | Fitbit Heart Rate |
| 33 | Fitbit Sleep |
| 37 | Garmin Health |
| 42 | Garmin Health Daily |
| 43 | Garmin Health Heart |
| 44 | Garmin Health Respiration |
| 45 | Garmin Health Sleep Daily |
| 46 | Garmin Health Sleep |
| 47 | Fitbit Activity Summary |
| 48 | Garmin Health Pulse Ox |
| 49 | Garmin Health Stress |
| 50 | Garmin Health Body Composition |
| 51 | Garmin Health User Metrics |
| 52 | Weather |
| 53 | Fitbit Activity |
| 54 | Fitbit Sleep Level |
| 55 | Fitbit Active Zone |
| 58 | WHOOP Workout |
| 59 | WHOOP Sleep |
| 60 | WHOOP Recovery |
| 61 | Polar Exercise |
| 62 | Polar Sleep |
| 63 | Polar Continuous Heart Rate |
| 64 | Polar SleepWise Circadian Bedtime |
| 65 | Polar SleepWise Alertness |
| 66 | Fitbit Weight Log |
| 67 | SensorKit Heart Rate |
| 68 | SensorKit Accelerometer |
| 69 | SensorKit Rotation Rate |
| 70 | SensorKit Ambient Light |
| 71 | SensorKit Ambient Pressure |
| 72 | SensorKit Device Usage Report |
| 73 | SensorKit Keyboard Metrics |
| 74 | SensorKit Message Usage Report |
| 75 | SensorKit On Wrist State |
| 76 | SensorKit Pedometer |
| 77 | SensorKit Phone Usage Report |
| 78 | SensorKit Telephony Speech Metrics |
| 79 | SensorKit Siri Speech Metrics |
| 80 | SensorKit Visits |
| 81 | SensorKit Wrist Temperature |
| 82 | Hexoskin Shirt |
| 83 | Garmin Health SDK Logged Accelerometer |
| 84 | Garmin Health SDK Logged Heart Rate |
| 85 | Garmin Health SDK Logged Stress |
| 86 | Garmin Health SDK Logged Steps |
| 87 | Garmin Health SDK Logged SpO2 |
| 88 | Garmin Health SDK Logged Respiration |
| 89 | Garmin Health SDK Logged BBI |
| 90 | Garmin Health SDK Logged Zero Crossing |
| 91 | Garmin Health SDK Logged Actigraphy |
| 92 | Garmin Health SDK Logged Enhanced BBI |
| 93 | Garmin Health SDK Logged Wrist Status |
| 94 | Garmin Health SDK Logged Skin Temperature |
| 95 | Garmin Health SDK Logged Gyroscope |
| 96 | Garmin Health SDK Sleep |
| 97 | Garmin Health SDK Watch GPS |
| 98 | HealthKit Activity |
| 99 | HealthKit Vital Signs |
| 100 | HealthKit Sleep Analysis |
| 101 | Garmin Health SDK MoveIQ Event |
| 102 | Garmin Health SDK Motion Intensity |
| 103 | HealthKit State of Mind |
| 104 | App Usage |
| 105 | Web Activity Tracking |
| 106 | Keyboard Input Event |
| 107 | Garmin Health SDK Heart Rate Variability |
| 113 | SensorKit Media Events |
| 114 | SensorKit Odometer |
| 115 | SensorKit Face Metrics |
| 118 | Fitbit Food Summary |
| 119 | Oura Daily Activity |
| 120 | Oura Workout |
| 121 | Oura Session |
| 122 | Oura Heart Rate |
| 123 | Oura Sleep |
| 124 | Oura Daily Readiness |
| 125 | Oura Daily Sleep |
| 126 | Oura Daily SpO2 |
| 127 | Oura Daily Cardiovascular Age |
| 128 | Oura Daily Stress |
| 129 | Oura VO2 Max |
| 130 | Oura Daily Resilience |
| 131 | Oura Rest Mode Period |
| 132 | Mira Hormone Test Results |
| 133 | Mira Daily Log |
| 134 | Mira Cycle |
| 135 | App Usage iOS |
| 136 | Garmin SDK Real-Time Respiration |
| 138 | SensorKit ECG |
| 139 | SensorKit PPG |
Direct Database Access
While Avicenna’s data export feature allows you to create complex queries and export study data as CSV, some advanced analyses may require direct database access.
We can provide your team with direct access to query and work with the study database. Currently, this feature is not automatically enabled. If you need direct database access, please contact Avicenna Support
Handling of Timezones
All data in Avicenna is time-stamped, stored, and exported in UTC. This includes the time_bin column of the record counts file.
Using UTC ensures consistency across participants, devices, locations, and daylight saving time changes. You can convert timestamps to participants’ local timezones during analysis or visualization if needed for interpretation or alignment with study protocols.
Export Time Range Interpretation
The dates you select on the Data Export page are interpreted in the time zone of the computer you are using, not the study’s time zone or the participants’ time zones. Each selected date is taken as midnight at the start of that day in your local time zone and then converted to UTC.
For example, if your account time zone is set to America/Los_Angeles and you choose a time range of 2026-04-12 00:00 to 2026-04-13 00:00 on the Data Export page, we interpret those times as Los Angeles local time, convert them to UTC, and then use the resulting UTC range to select the corresponding participant data in the export.
If you want to make sure no participant data is missed, select a slightly wider range, for example 1–2 days before and after your intended window, and filter precisely during analysis.
Troubleshooting
I see extra lines in the exported CSV files
When working with the exported CSV files (e.g., survey responses), cell values with line breaks may appear as extra lines in some text editors. The CSV format handles this by enclosing such content in double quotes ("). Most data analysis tools (e.g., Excel, Google Sheets, R, Python) correctly interpret these quoted fields.
Solution:
Try importing the CSV into a spreadsheet application like Google Sheets and see if the issue persists.
My data export is taking too long or failing
Large exports, especially sensor data for many participants over extended periods, can exceed processing limits. If your export is taking unusually long, timing out, or failing to complete, the file may simply be too large.
Solution:
To make the export more manageable, break it into smaller chunks by following these steps:
- Navigate to Data Export: Open the Researcher Dashboard and go to the Data Export page.
- Select fewer participants: In the participants selection field, choose one participant at a time, or split your participant list into smaller groups (e.g., 5–10 participants per export). Avoid selecting all participants at once.
- Choose a specific data source: In the data type dropdown, select only one data source (e.g., GPS or Accelerometer). Create separate export requests for each data source type you need.
- Specify a narrow date range: Export shorter periods (e.g., one week or one month) instead of all historical data. Break the total time span into consecutive ranges.
- Submit the Export Request: Click
Export asand select your preferred format. Wait for the export process to complete, and once the status shows Ready, click the arrow icon to download the file.
This approach improves export reliability and makes it easier to manage and process your data files.
I cannot create a new export
A study can hold a maximum of 100 data exports at a time. If you have reached this number, select some of the older exports on the Data Export page and delete them, then create your new request.