Data sources enable passive data collection from participants’ devices and wearables, operating through automatic and continuous background processes that collect physiological, behavioral , and environmental data. Unlike Activities such as surveys and cognitive tasks (which require active participant engagement and are triggered by specific events), data sources run continuously in the background.
In this article, we explain how to add, configure, view, export, and remove data sources in your Avicenna study.
Adding Data Sources
To add a data source to your study:
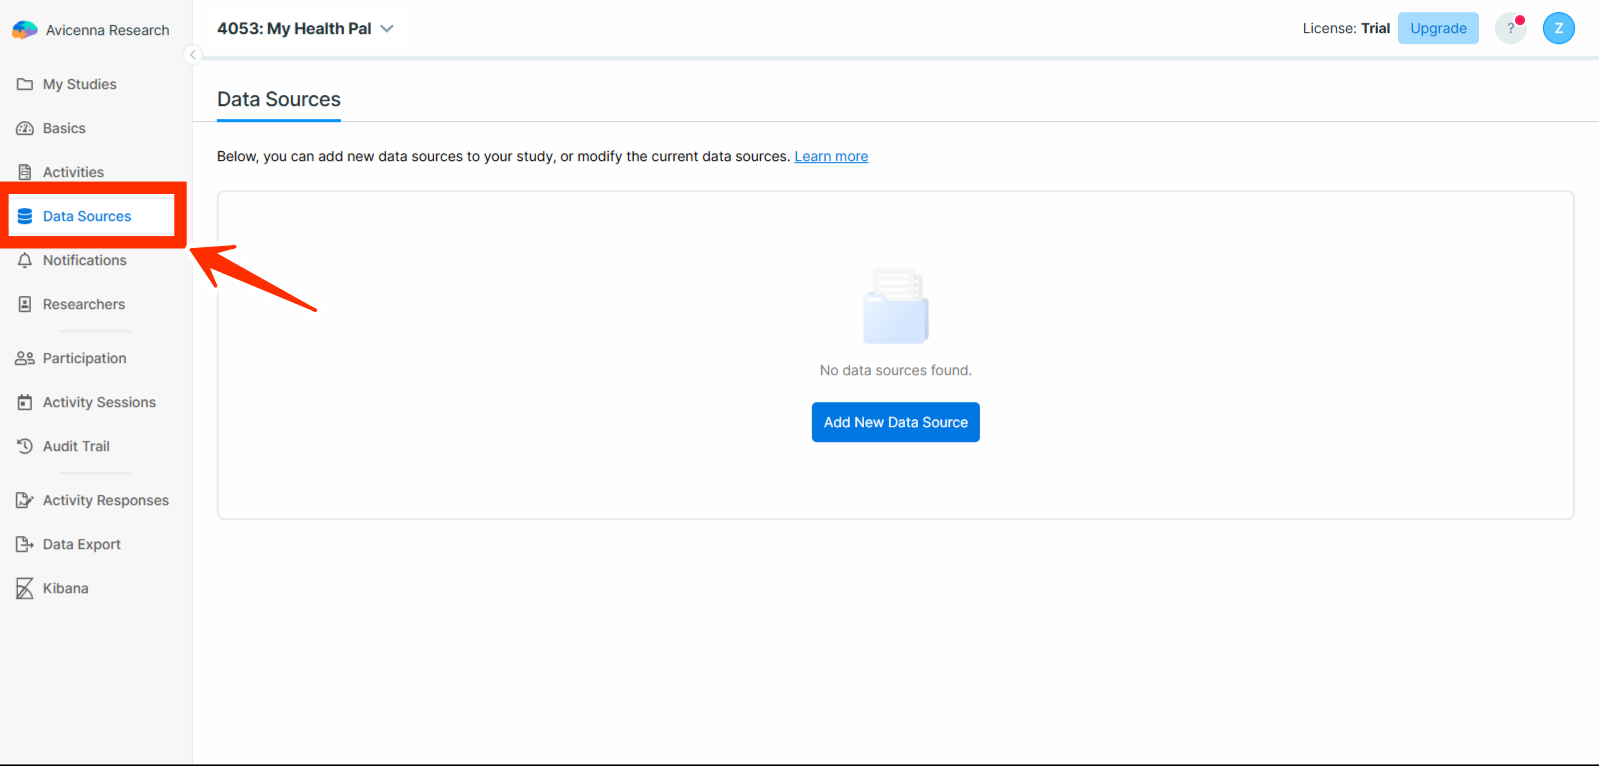
- Go to your study dashboard.
- Go to
Data Sourcessection.
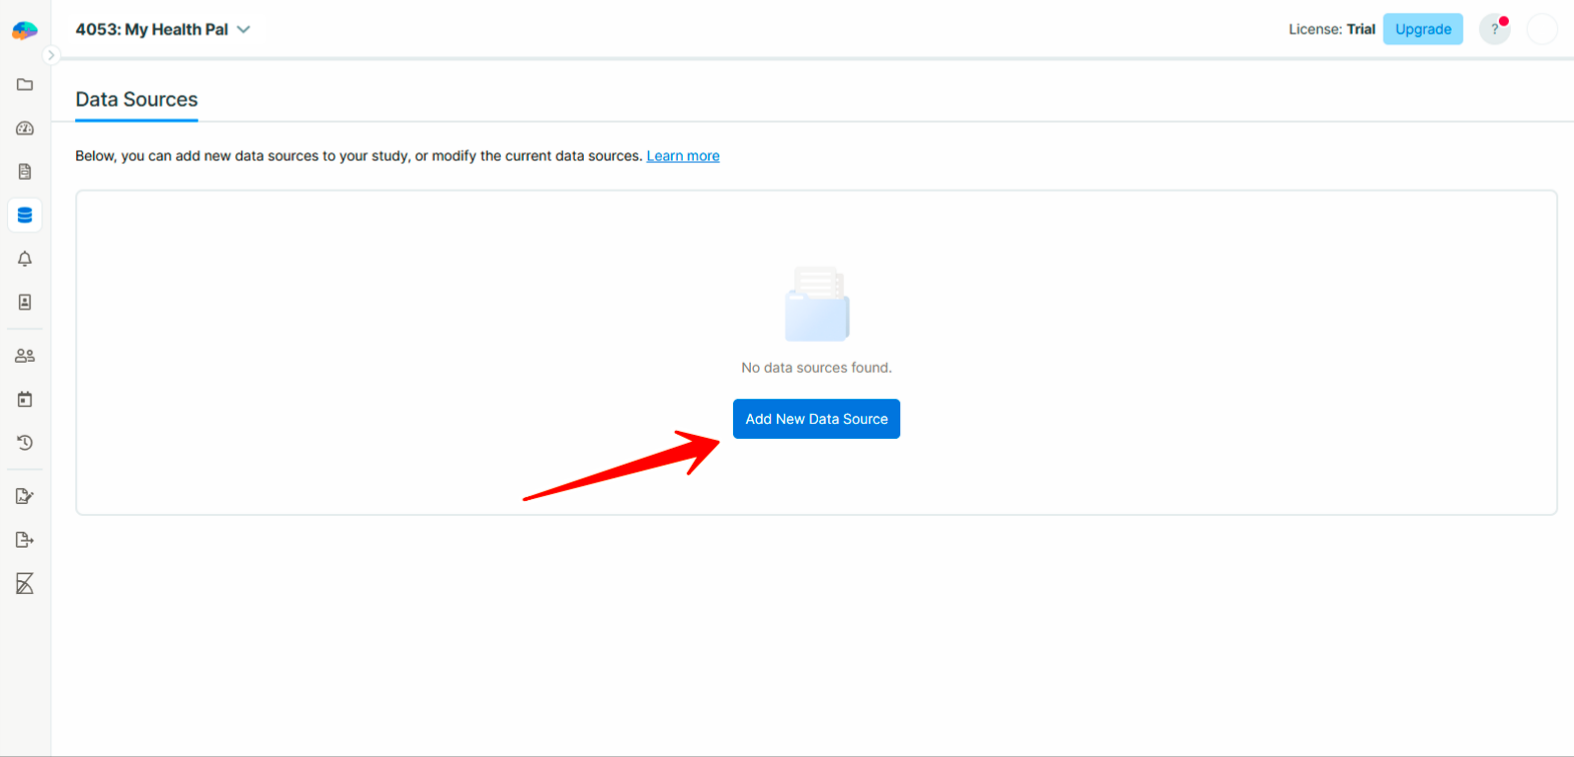
- Click on the
Add New Data Sourcebutton.
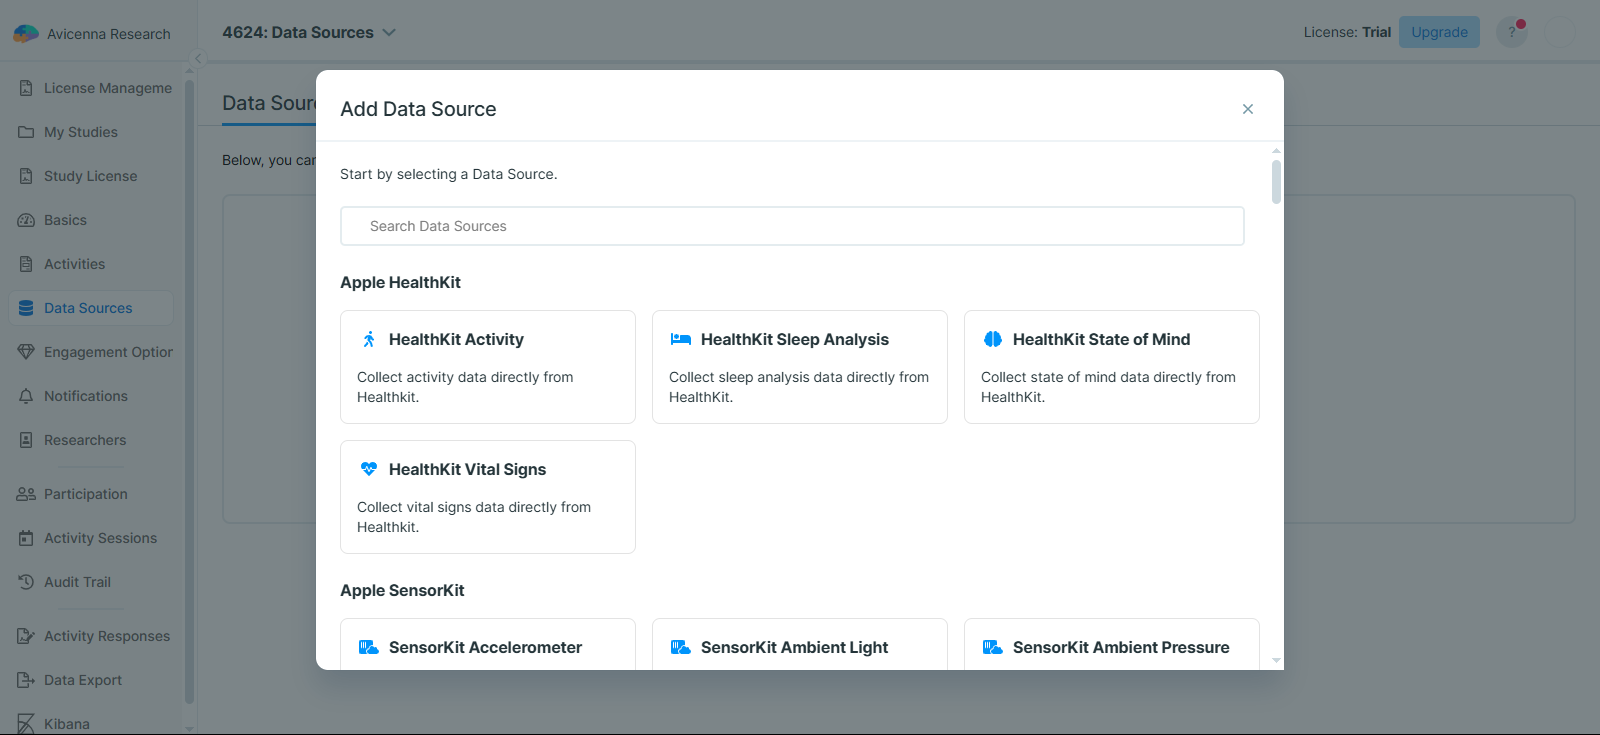
- Select a data source. You’ll see a list of data sources supported by Avicenna, organized into categories such as Apple HealthKit, Contact, Digital Footprint, and more. These categories help you quickly find data sources based on the type of information they collect. Scroll through the categories and select the data source that best fits your study’s needs.
You can also search among all data sources by type, category, or description using the search box.
- Configure the data source.
-
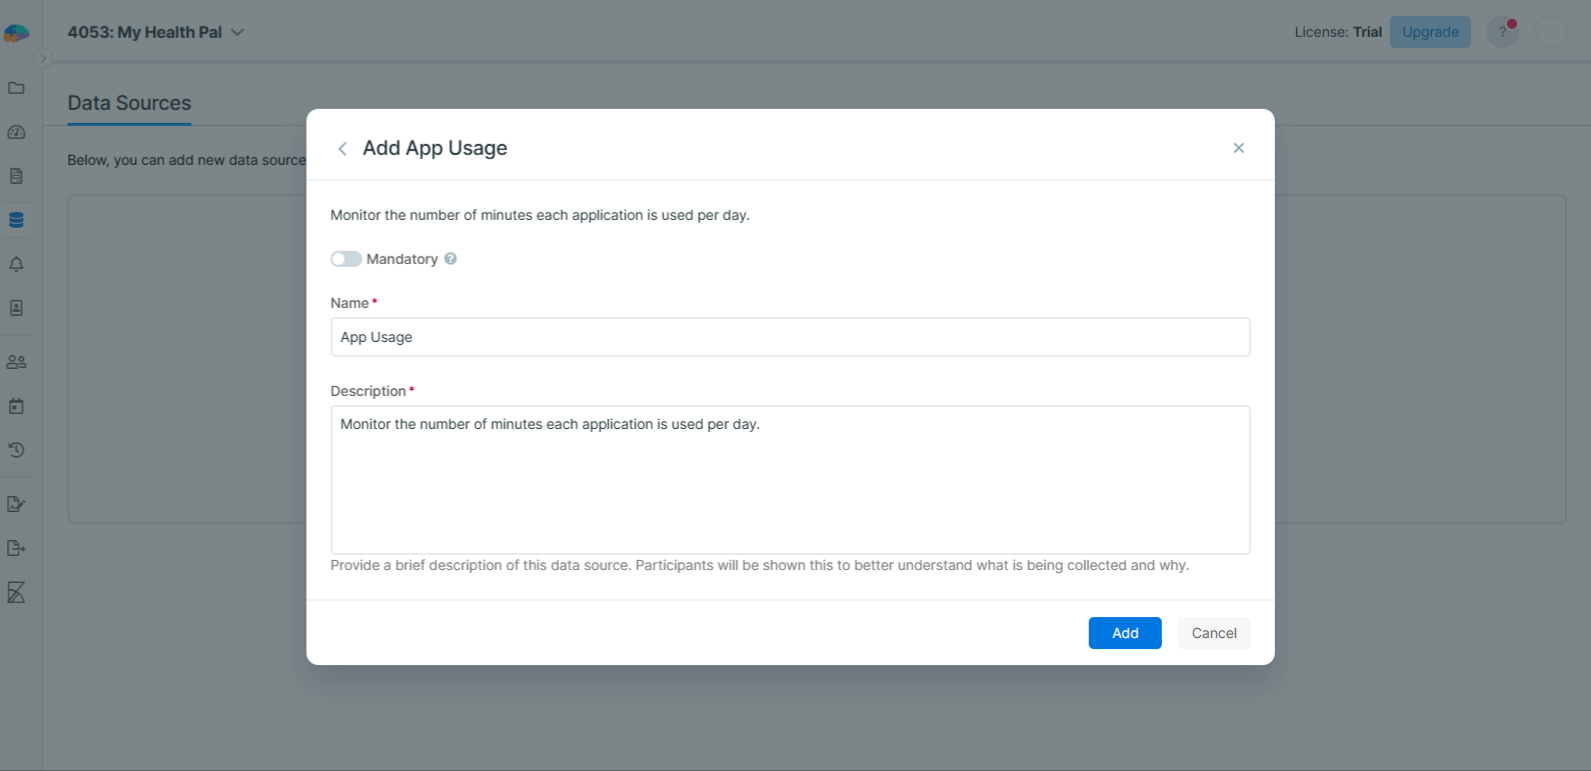
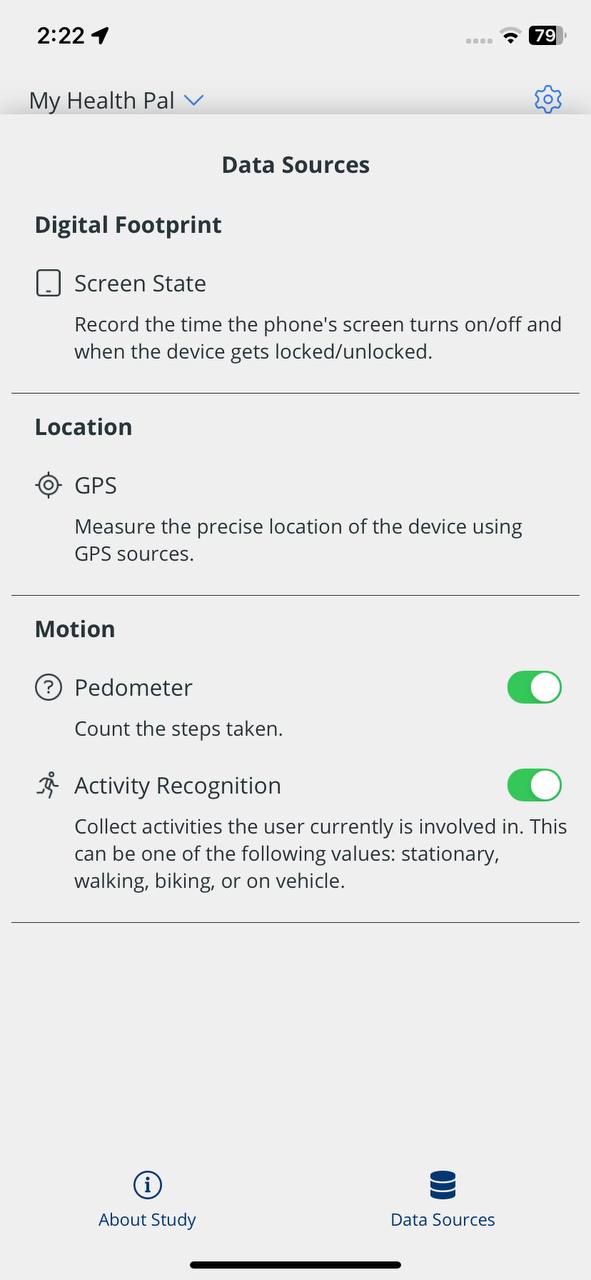
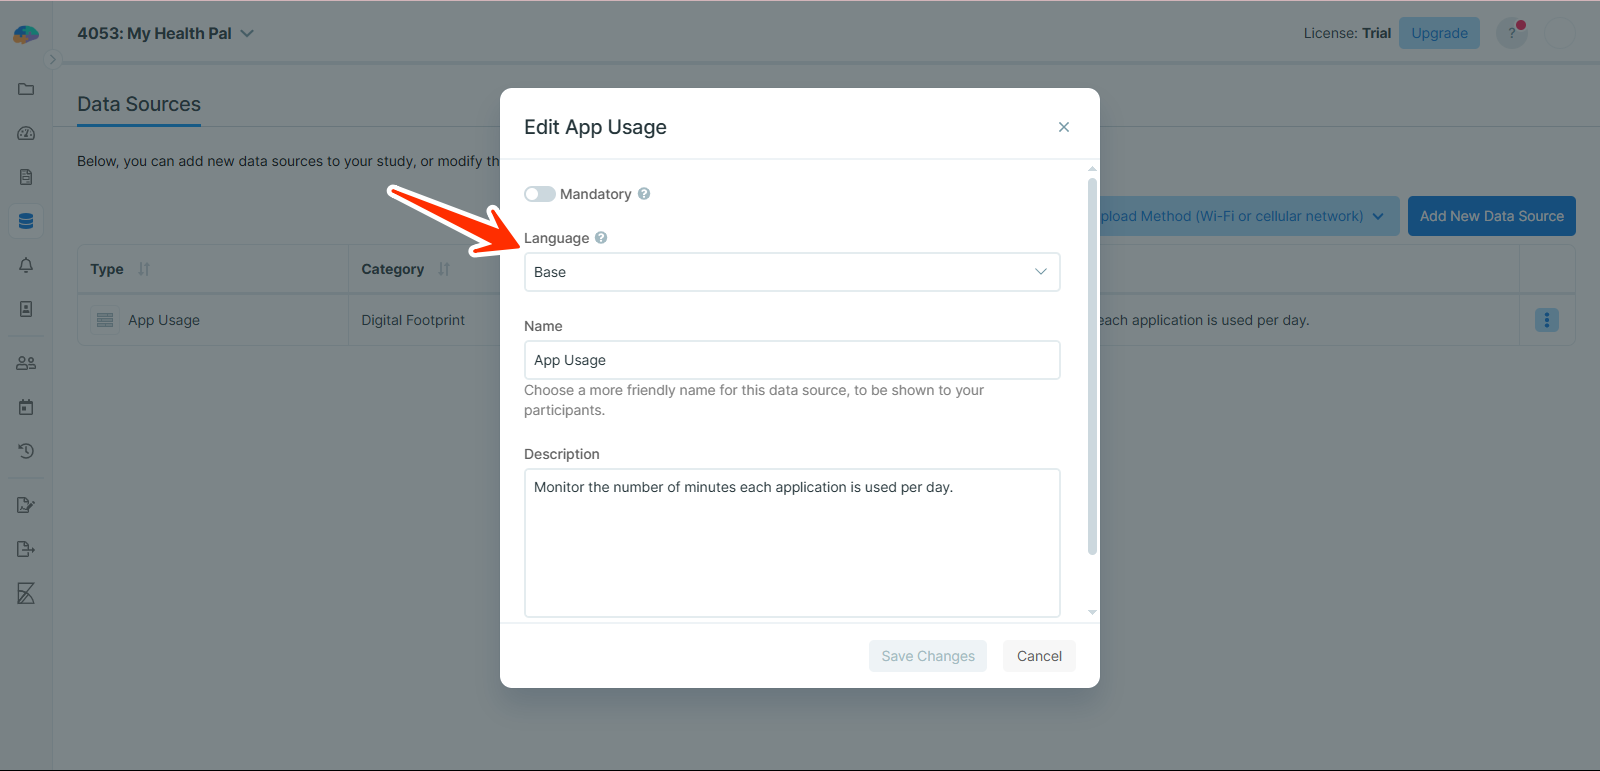
Mandatory vs. Optional: First, specify whether providing this data source is mandatory or optional for your study participants. For optional data sources, the Avicenna app displays a toggle that participants can use to enable or disable the data source. For mandatory data sources, this toggle is not displayed, so participants cannot disable the data source from within the app. However, participants can still revoke the permissions required for Avicenna to collect the requested data source by changing the app’s permissions in their phone’s settings. When the required permissions are not granted, this is reported in the Audit Trail.
Audit Trail. -
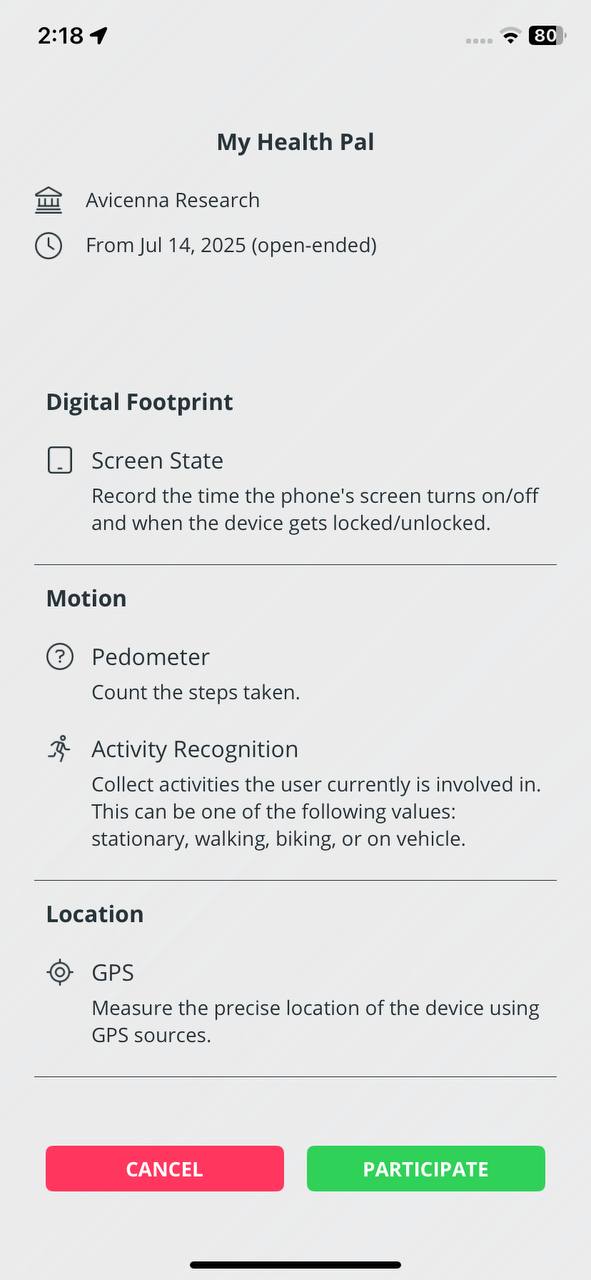
Name and Description: Then, you should choose a name and a description for your data source. These values will be shown to the participant to explain what is being collected and why. You may add more details on why your study collects certain data sources within the informed consent, but the description here can also help participants to better understand why a specific data source is needed for your study.
The example of the name and description shown to the participant:
- Click on
Addto finish adding the data source.
[!note]
Localization support: If your study is available in multiple languages, names and descriptions can be translated.
View Data Sources
Once data sources are added, you can view and manage them along with their configurations here. You can sort the list by type, category, name, and mandatory status.
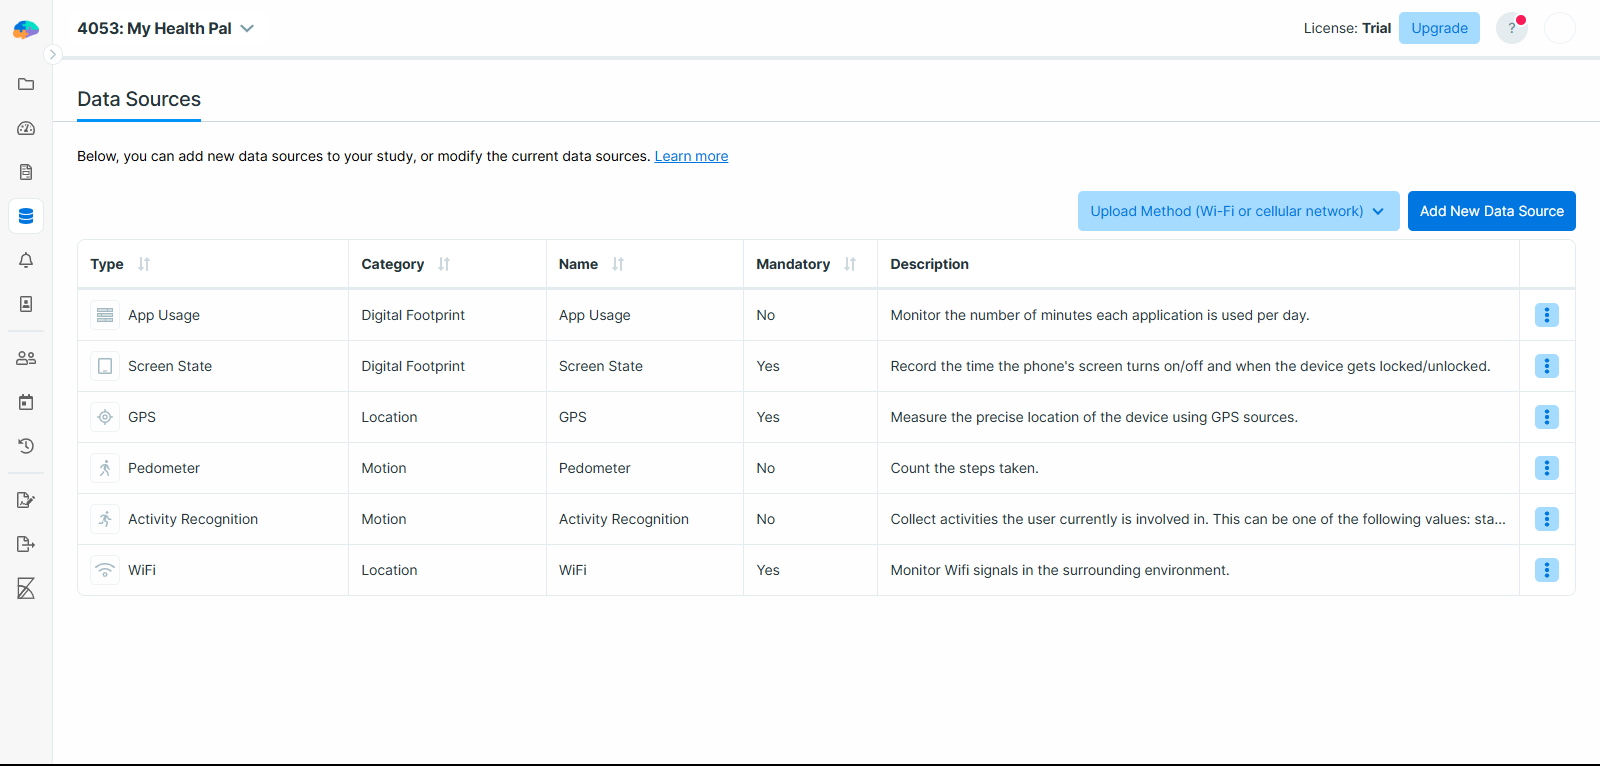
If you click on each data source’s menu, you can see the following options:
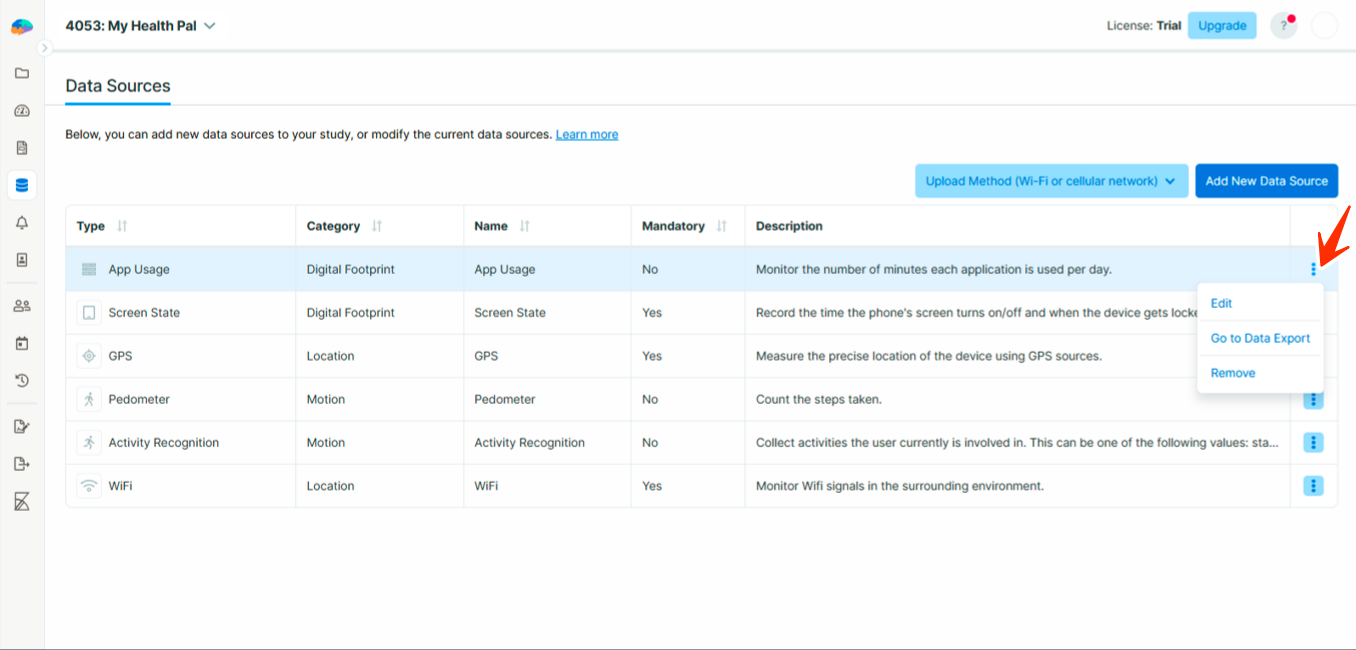
- Edit: To edit a data source’s configuration, simply press this button and apply your modifications.
- Go to Data Export: Pressing this button will take you to the Data Export page where you can export the data collected by this data source.
- Remove: Press this button and confirm your intent if you want to remove the data source from your study. This will stop collecting that data for your study immediately. If you want to delete the data for this data source as well, mark the Delete the data from the data source checkbox as checked. If for any reason you decided to delete the data after you deleted the data source with that checkbox left unchecked, please contact Avicenna support staff.
[!note]
If any activity in your study contains at least one Proximity triggering logic in its latest version (whether published or draft), the Bluetooth Beacon data source cannot be removed. Similarly, activities containing at least one Geofencing triggering logic will prevent removal of the GPS data source.
Export Data
To learn more about exporting data, please visit this page.
Common Data Fields
You can access the collected data either by exporting them via the Data Export page, or by directly querying them using Kibana. The data format is different based on the data source, for example, GPS data contains location coordinates, while the Pedometer data contains the number of steps taken. Regardless, there are some common fields for each record of each data source that we explain below.
Study ID: The unique ID of the study provided the data. Internally stored as study_id.
User ID: The unique ID of the participant provided the data. Internally stored as user_id.
Device ID: The unique ID of the smart device provided the data. Internally stored as device_id.
Record Time: The time this record was captured. Internally stored as record_time.
Relative Record Time: The time this record was captured, relative to the participation period’s start time, in milliseconds. For example, 3,600,000 indicates the record was captured 1 hour after the participant joined the study. Internally stored as rel_record_time. Please note that this field won’t be updated if you change a participant’s start time.
Data Collection Behavior of Avicenna
Avicenna supports data collection from Android, iOS, and wearable devices.
Permissions and Setup Flow
Some data sources require specific permissions. When participants join a study that includes such sources and permissions haven’t been granted yet:
A message appears at the top of the study homepage, stating that the study setup is incomplete.
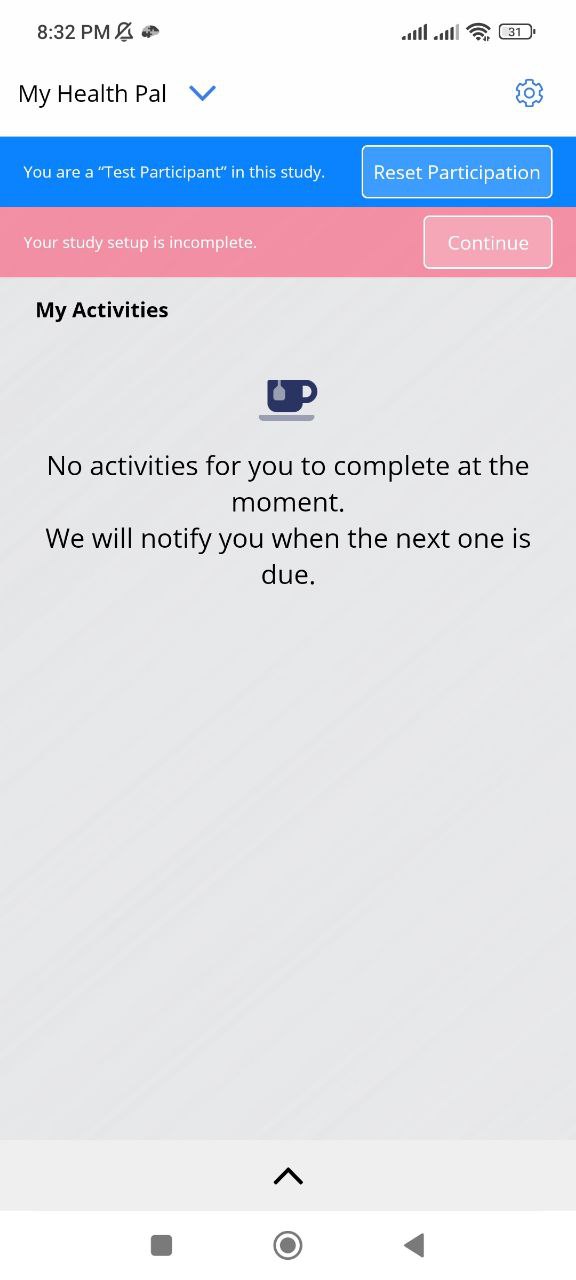
Participants must either:
- Grant the required permissions, or
- Select “Don’t have this device” (available only for wearable data sources).
This excludes that specific data source for the participant.[!note]
Participants can later revisit the Data Sources page to update permissions. The Avicenna app also allows participants to revoke permissions at any time.
Web-Only Participation
Participants using only the web app cannot contribute data from phone-based sensors. However, wearable data can still be collected, because:
- Wearable data is pulled from OEM servers (e.g., Garmin), not directly from the device.
- Participants grant access to their account on the wearable provider’s server.
- Avicenna fetches this data at the end of every day.
Phone Sensor Data Collection Timing
For mobile sensors like GPS and Pedometer, Avicenna requests data from the OS once every 5 minutes.
- iOS guarantees this 5-minute interval
- Android doesn’t guarantee it and might provide data either less often or more often than 5 minutes.
Sensor Data Collection Models
1. Continuous Collection
In this approach, the device’s OS continuously collects data. The OS then provides all the collected data to the Avicenna app when Avicenna queries it from the device. For example, Android and iOS devices continuously count the participant’s steps. If a study has the Pedometer sensor enabled, the Avicenna app queries the pedometer data once every 5 minutes (as configured via the Interval Settings feature), but it gets the total number of steps taken since the last request. So even though the Avicenna app queries data once every 5 minutes, it collects all steps taken by the participant. Similarly, Android and iOS always check whether the screen is on or off. When the screen state changes, the OS notifies the Avicenna app, regardless of the 5-minute data query interval.
2. Episodic (Burst-Based) Collection
In this approach, Avicenna asks the OS at the interval defined in Interval Settings (e.g., every 5 minutes) to collect data for a certain period, called Burst Length. The burst length is different for different data sources. For example:
- GPS: collects data until it reads three accurate points within a maximum of 60 seconds.
- Battery: collects one record per cycle.
- Accelerometer: collects data for 60 seconds.
Data Collection Configuration
The Data Collection Configuration feature allows researchers and participants to manage how frequently data is collected from non-cloud-based data sources, such as GPS, accelerometer, or motion sensors. This includes:
- Continuous GPS Data Collection: Collect location data continuously. Learn more here.
- GPS Battery Optimization Setting: Manage battery usage during GPS data collection. Learn more here.
- Interval Settings: Adjust how often data is collected from each sensor. Instructions for this setting are provided below.
[!note] Note
Configurations set by Test participants take priority over those set by the researcher.
Researcher
To adjust the data collection interval for your study, follow these steps:
-
Go to the Data Sources page on your dashboard.
-
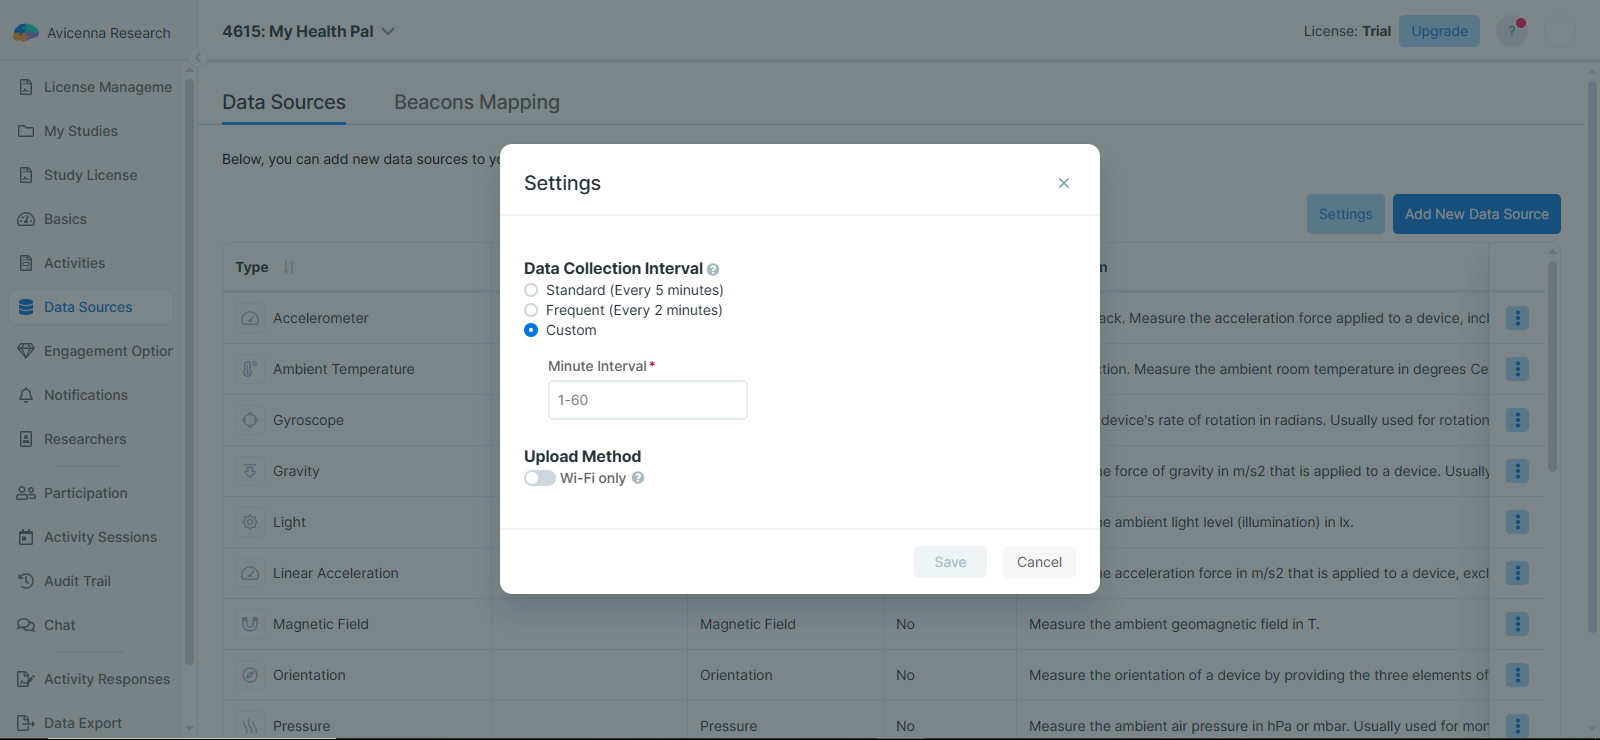
Click on Settings.
-
Choose one of the following data collection interval options:
- Standard (Every 5 minutes)
- Frequent (Every 2 minutes)
- Custom (Between 1 and 60 minutes)
[!note] Note
This setting will be applied to all non-cloud-based data sources in your study.
Participant
[!note]Note
Only Test participants can adjust the interval.
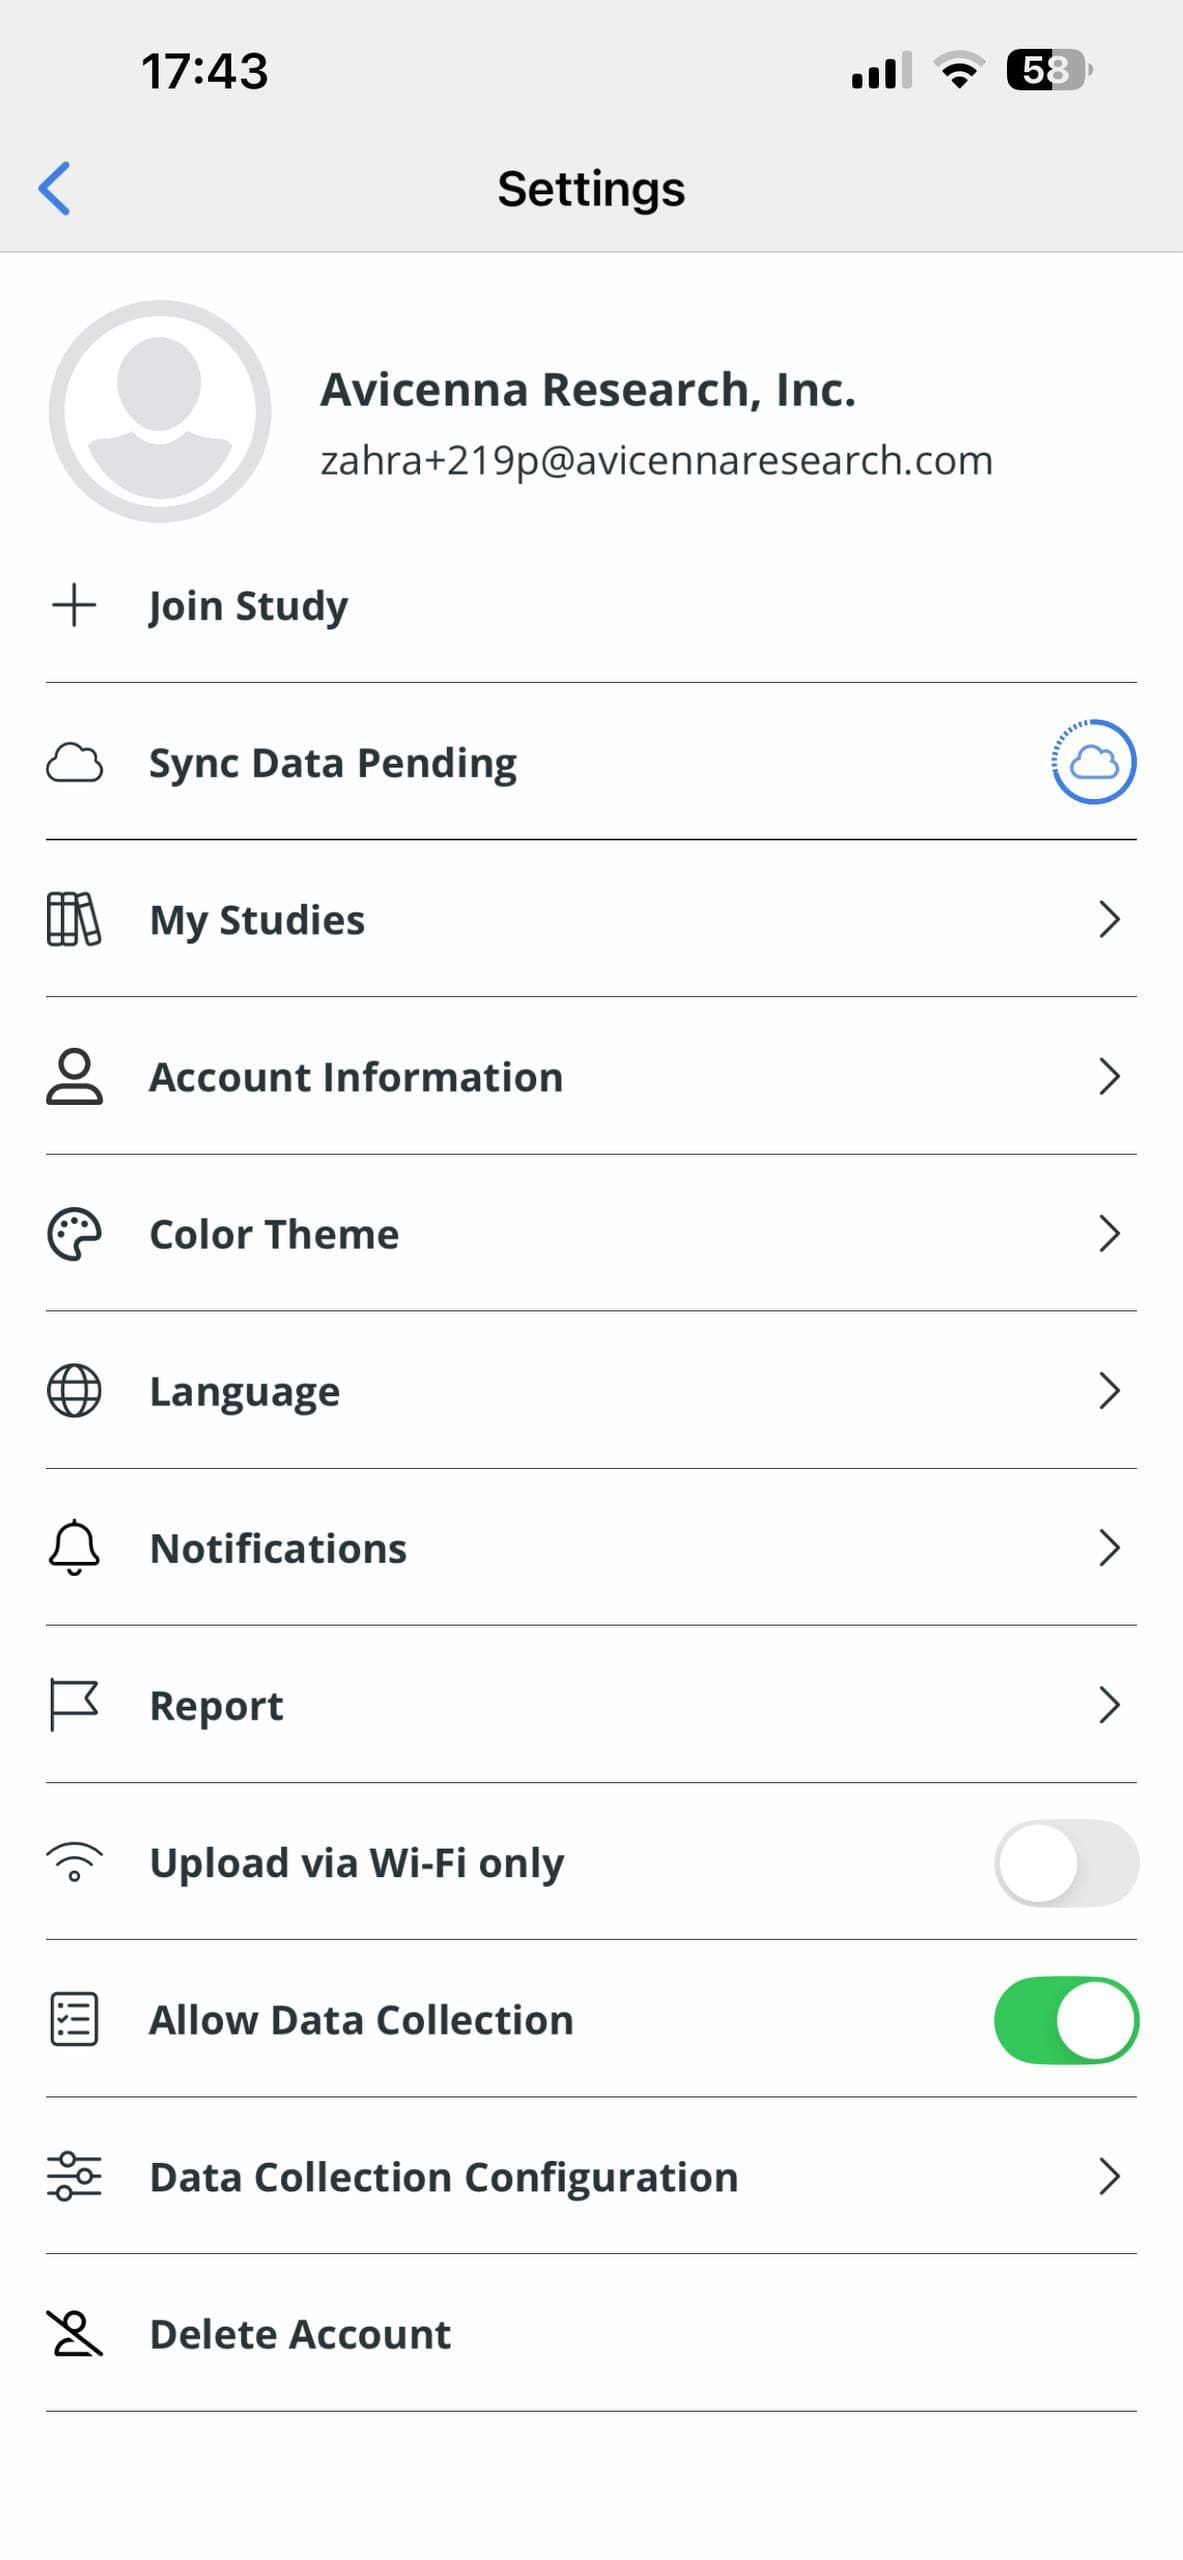
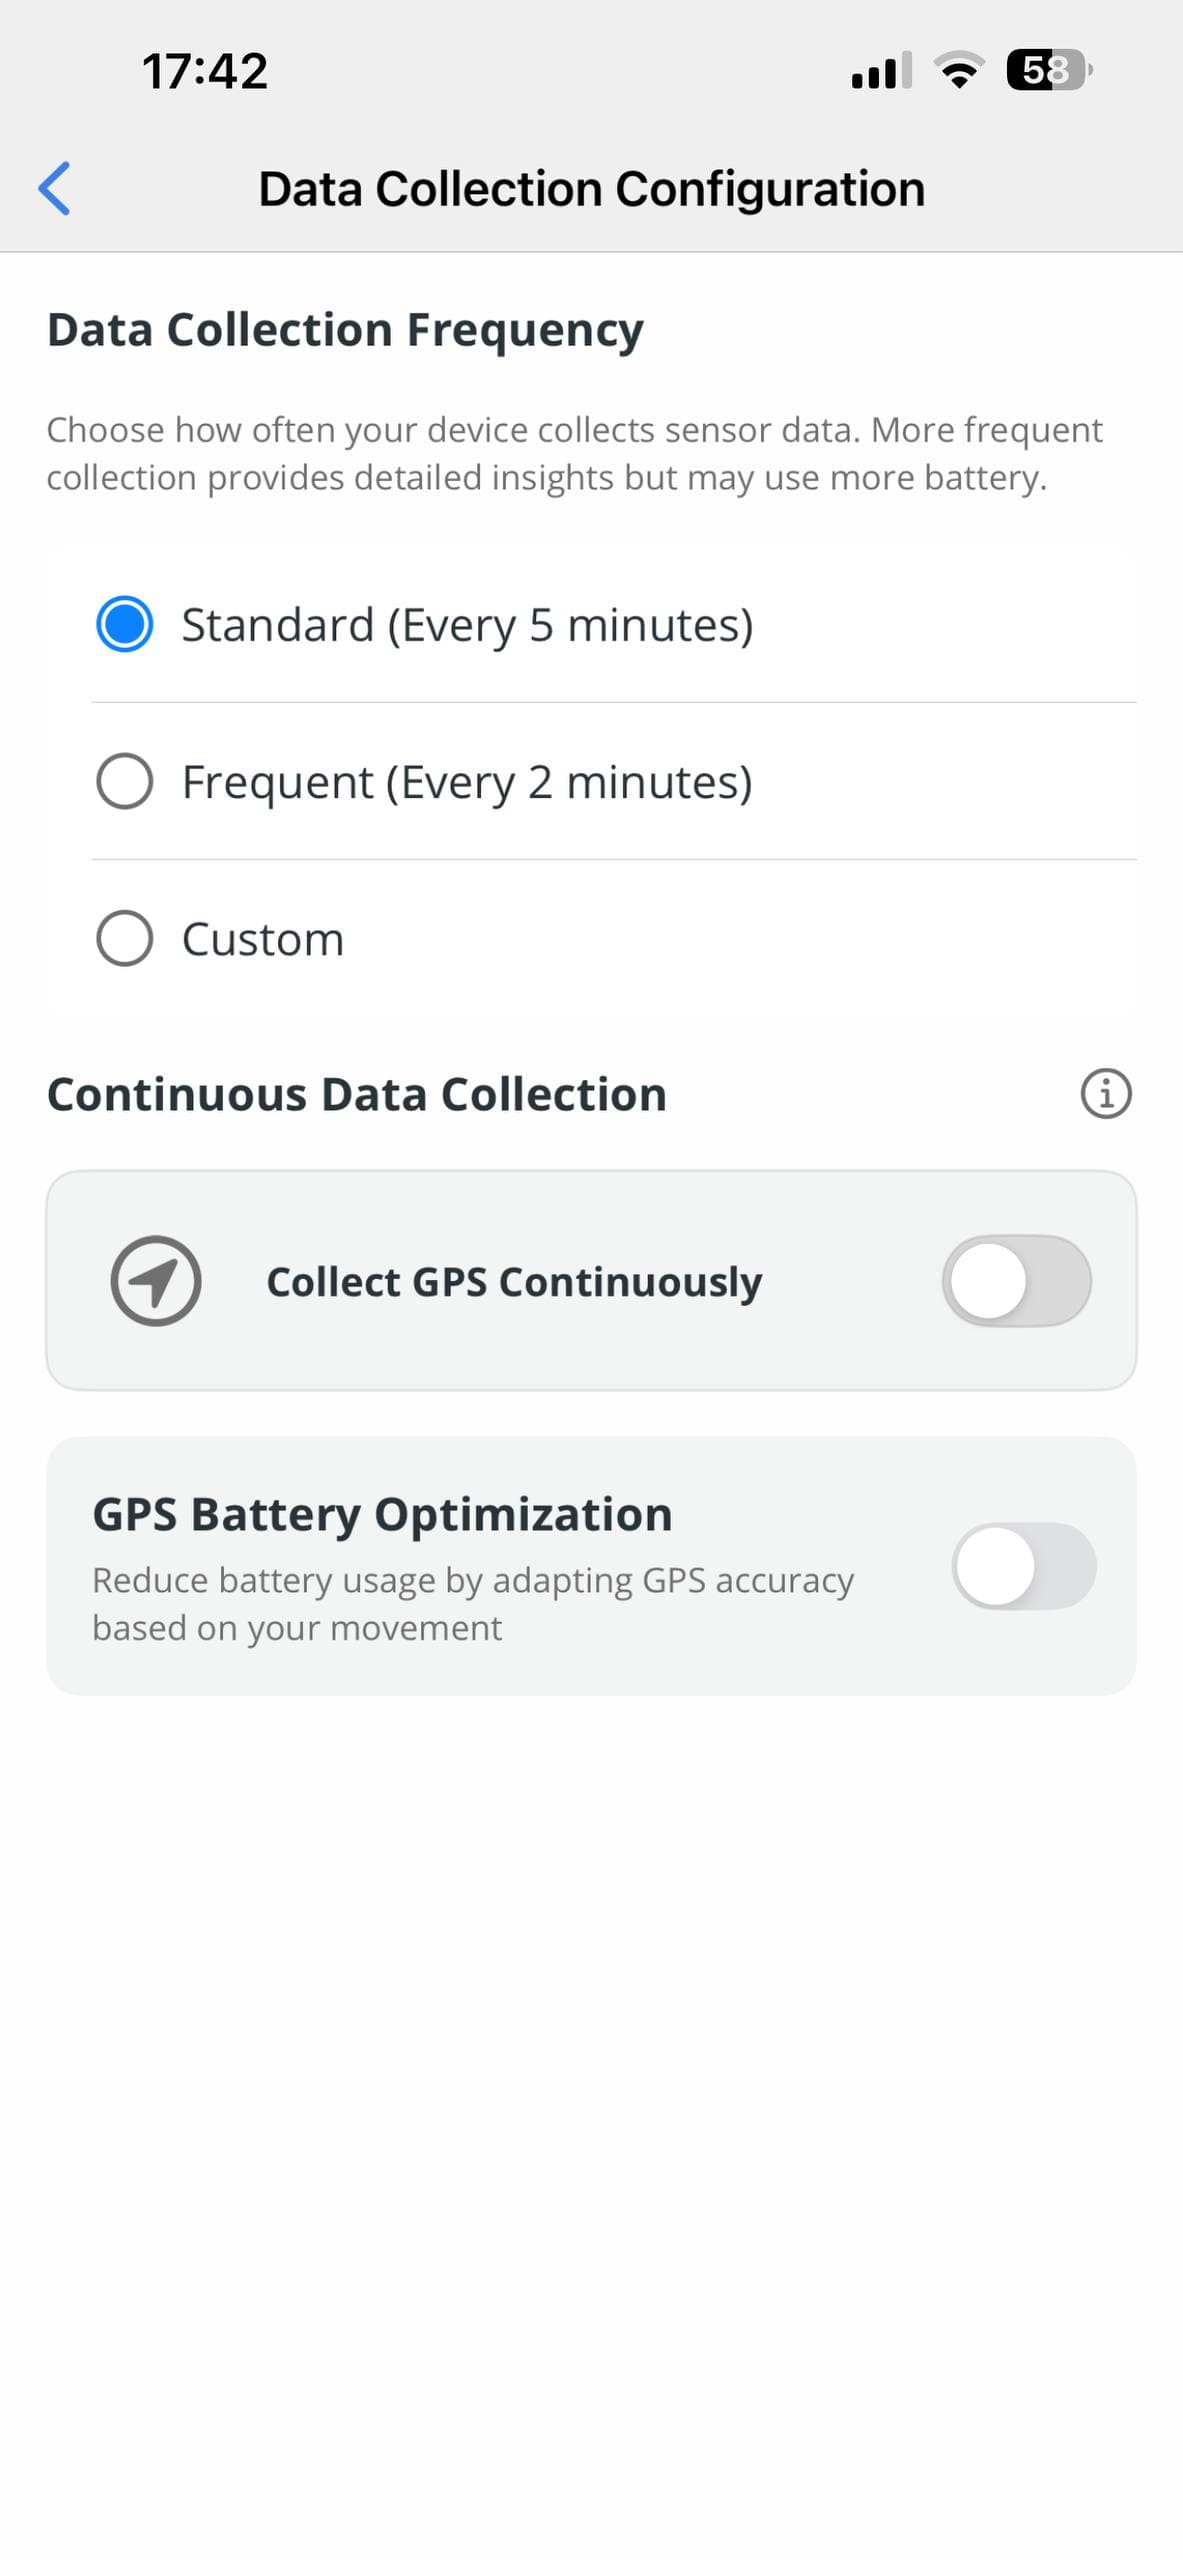
To adjust the data collection interval in the mobile app, follow these steps:
-
Go to Settings → Data Collection Configuration.
-
You can choose from the following options:
- Standard (Every 5 minutes)
- Frequent (Every 2 minutes)
- Custom (between 1 to 60 minutes)
Troubleshooting
Low or missing records
If you think some data records are missing or there are fewer data records than you expected, whether after exporting/downloading the data or by viewing the In-Operation or other plots on the Participation page:
- Check the general steps to diagnose participation issues.
- Check if the study setup (that pink banner at the top of the study’s homepage) is completed. You can check the Application State logs on Kibana to see which permissions are granted/revoked or not granted at all. Note that some data sources might not need specific permission. On the other hand, the participant should prevent the mobile app from being restricted/terminated by the operating system. Check these pages for more details:
- If you haven’t marked your data source as
Mandatory, the participant might have opted out of its data collection. You can check that by theStudy Data Sourcesfield under Application State logs on Kibana. - Check the data collection behavior of Avicenna to understand possible limitations and differences between Android and iOS, and see what you can expect in general. For each data source, check the additional details, if any, on the collection behavior under their own pages. For example, for GPS, see this section. This is especially useful if you checked the In Operation status and thought it was low; a value less than 100% does not necessarily translate to data loss.
- Check if the participant is using the web app by checking their devices. Some data sources (e.g., GPS) collect data using mobile apps only.
- Check for the “Data Collection Failed” and “Data Collection Cycle Did Not Start” audit logs. The first log type includes the reason behind the failure too, which might be, for example, due to the device not supporting the corresponding sensors.
- Check if the sensor is working properly on the device. You can test that by collecting similar data using other apps or, in the case of wearable data sources (e.g., Garmin), see if you or the participant can see any data under the corresponding accounts.
- When working with the exported CSV files (e.g., survey responses), cell values with line breaks may appear as extra lines in some text editors. The CSV format handles this by enclosing such content in double quotes (
"). Most data analysis tools (e.g., Excel, Google Sheets, R, Python) correctly interpret these quoted fields.
Try importing the CSV into a spreadsheet application like Google Sheets and see if the issue persists.