Avicenna Researcher Dashboard offers different aggregate reports to help you monitor their adherence throughout the study. However, when you want to understand how often and when participants opened a particular activity, such as a report tab or a survey, the aggregate reports are not enough.
In these cases, the Audit Trail provides the granular data you need. Every time a participant opens an activity, Avicenna records the event as an Activity Opened audit log. By filtering and exporting these logs, you can analyze in-app engagement with a specific activity for a single participant or across all participants of a study.
To follow this guide, you will need:
- Researcher access to the target study with permission to view the Audit Trail.
- The ID of the activity you want to track (available on the Activities page of the Researcher Dashboard).
1. Open the Audit Trail Page
On the Researcher Dashboard, select the target study at the top of the page and click Audit Trail on the left-side panel. The Audit Trail table lists all events in descending order based on the “Date Time”. Each row shows an “Audit Log”, an interaction triggered by a participant, a researcher, or the system itself.
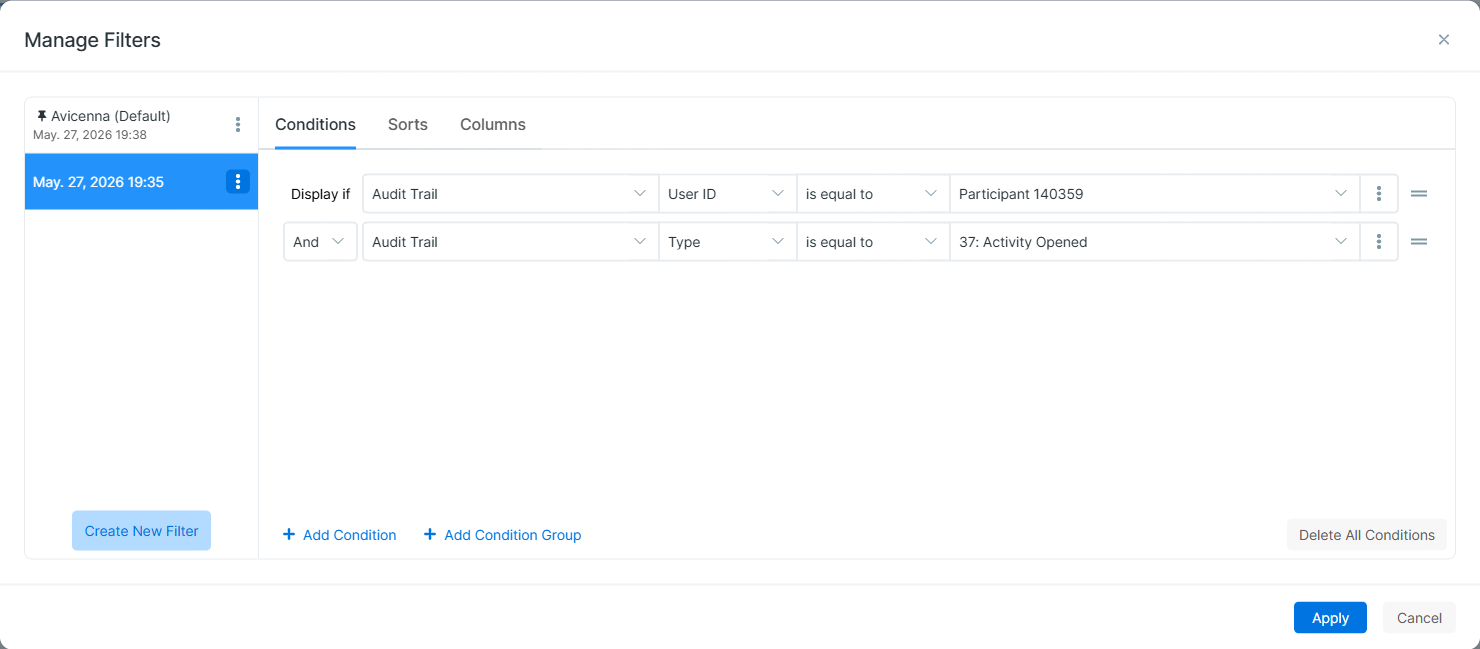
2. Filter for “Activity Opened” Events
Assuming you are familiar with creating a filter, open the Manage Filters dialog and add the following condition:
- Category: Audit Trail
- Field: Type
- Operator: is equal to
- Value: 37: Activity Opened
[!note]
You can optionally narrow the results to a single participant by adding a second condition:
Category = Audit Trail, Field = User ID, and Value = [Participant ID].
If you omit theUser IDcondition, the results include the logs of all participants in the study.
3. Narrow to a Specific Activity
To limit the results to a single activity, add a third condition to your filter:
- Category: Audit Trail
- Field: Related Activity IDs
- Value: [Your Target Activity ID]
The Related Activity IDs column specifies which activities the event relates to, narrowing your logs strictly to the opens of that specific activity.
4. Export the Results
Once the filter is applied, click the Export as CSV button located next to the Filter button to download the filtered audit logs. The exported file includes the same columns as the Audit Trail table, including Role, User ID, Type, Date Time, Related Participant IDs, Related Activity IDs, Message, and App Version. Each row corresponds to a single activity open event.
5. Workaround for the Related Activity IDs Filter
If combining the Related Activity IDs condition with other filters returns no results due to system limitations, you can filter the data externally:
- Apply only the Type = 37: Activity Opened filter (and optionally the User ID filter) in Avicenna.
- Export the results as a CSV.
- Open the file in Excel or Google Sheets, and manually filter the Related Activity IDs column for your target Activity ID.
6. Analyze the Data
Once your data is filtered, you can begin your analysis:
- Frequency: Count the rows per Related Participant IDs to see how often each participant interacts with the activity.
- Behavioral Patterns: Parse the Date Time stamps to identify time-of-day or day-of-week engagement trends.
- Adherence: Compare actual open events against your study’s expected session schedule.
[!note]
For more advanced or large-scale analyses, the same Audit Logs are also accessible through Kibana via theaudit-trailindex.