Understanding smartphone use is crucial for digital health and behavioral research, and app usage data provides objective insights into screen time and daily habits beyond self-reports.
Avicenna supports app usage data collection on both Android and iOS using platform-specific mechanisms.
[!note]
All app usage data collected by Avicenna is privacy-preserving: no content from applications (e.g., messages, media, or user input) is ever captured, only metadata such as app identity, duration, and usage patterns.
Below, we explain how Avicenna collects app usage data on each platform and what data each method provides.
Android App Usage
This data source records how often and how long participants use each app on their Android device.
Use Cases
- Mental health research: Analyzing app usage patterns to understand the relationship between screen time, social media use, and mental health outcomes
- Physical activity and sedentary behavior: Measuring sedentary time and linking prolonged app use to a lack of physical activity and its health consequences
- Sleep research: Investigating how screen time affects sleep hygiene and quality
- Cognitive and behavioral science: Gaining insights into a user’s daily routines, multitasking habits, and reliance on specific apps to understand cognitive load and behavioral tendencies
Data Structure
Besides the common data fields, each record contains:
- App Name: The user-friendly name of the app. Internally stored as
app_name. - App Package Name: The unique bundle identifier of the app. Internally stored as
app_package_name. - App Version: The version of the app being used. Internally stored as
app_version. - Start Time: The timestamp of when the app entered the foreground. Internally stored as
start_time. - End Time: The timestamp of when the app left the foreground. Internally stored as
end_time. - Duration: The amount of time, in seconds, rounded down to the nearest second, that the app was in the foreground. Internally stored as
duration.
[!note]
Due to Android OS limitations, app names may sometimes be recorded as “Unknown.” However, the package name is always available and can be used to identify apps.
Adding App Usage As a Data Source
See Adding Data Sources.
Data Collection Behavior
The App Usage data source collects data for all apps that run in the foreground on the participant’s Android device. Data collection starts automatically when the participant grants the necessary permissions and continues as long as the app is running and has the required permissions.
Monitoring and Exporting Android App Usage Data
There are two ways to monitor and export App Usage data using the Data Export page or using Kibana.
Android App Usage Data Source in the Participant App
After a participant joins a study, they need to grant access to Avicenna to collect app usage data. To do that, the participant needs to open the onboarding alert in the Avicenna app to complete the study setup. They will see the following page:
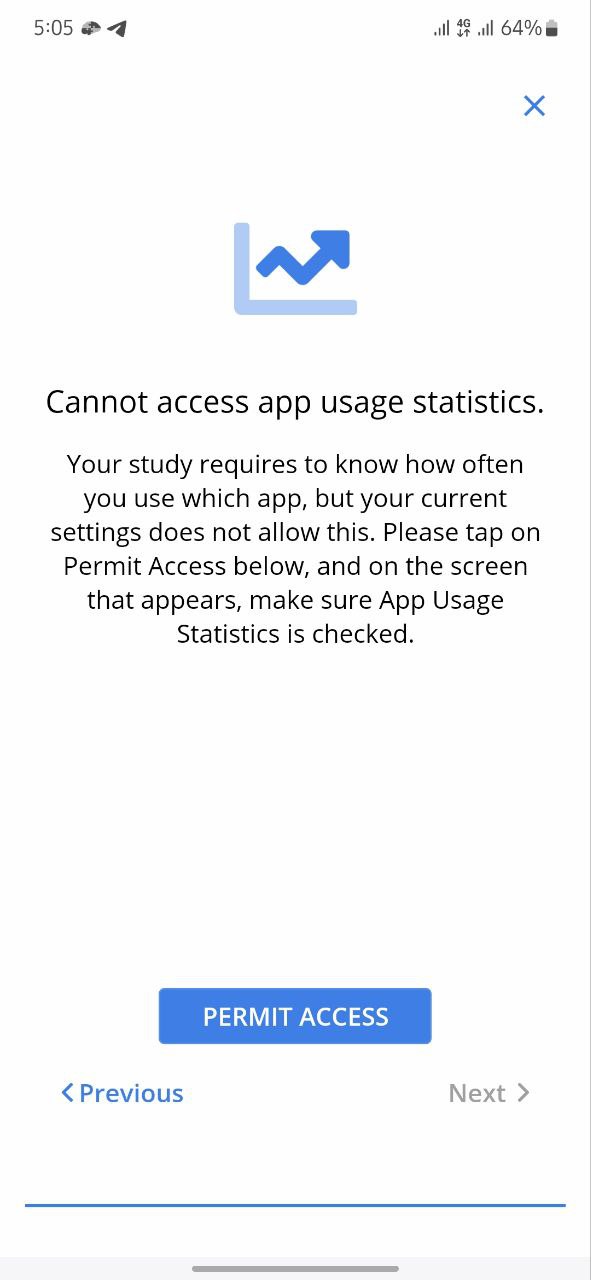
On this page, the participant needs to click on the PERMIT ACCESS button and follow the instructions to grant Avicenna access to collect app usage data.
[!note]
The participant can stop sharing the data anytime by going to theSettingsof their device.
iOS App Usage
Only available for studies using a Custom App.
The iOS App Usage feature in Avicenna consists of:
- iOS App Usage data source: Stores processed Screen Time usage data.
- iOS App Usage activity: Collects Screen Time reports from the participant’s device.
The iOS App Usage data source captures detailed app usage information from participants’ iOS devices using Apple’s Screen Time framework. It records which apps and websites participants use, how long they spend in each, how many notifications they receive, and how many times they pick up their device, aggregated per hour.
Unlike continuous background data sources, iOS App Usage data is collected only when the associated iOS App Usage activity is triggered and the participant completes the capture flow. The captured data does not include any application content, only usage metadata.
[!note]
Avicenna supports App Usage on iOS only on iPhone and iPad devices running iOS 16 or later.
Use Cases
- Mental health research: Analyzing social media usage and overall screen time to study their relationship with mental health indicators
- Behavioral pattern analysis: Measuring daily app usage patterns to understand routines and digital habits over time
- Attention and productivity research: Investigating how notification volume relates to stress, distraction, and task performance
- Web behavior analysis: Comparing web browsing patterns across participants and cohorts
Data Structure
Each record represents one app’s (or website’s) usage within a single hourly observation window.
Besides the common data fields, each record of iOS App Usage data in Avicenna includes the following fields:
- Record Time: Timestamp when the data was submitted to the server, in milliseconds (epoch milliseconds). Internally stored as
record_time. - Relative Record Time: Time relative to the participant’s registration start. Internally stored as
rel_record_time. - Device ID: Unique identifier of the participant’s device. Internally stored as
device_id. - Bundle ID: App bundle identifier (e.g.,
com.apple.Maps,com.instagram.Istanbul). Internally stored asbundle_id. - App Name: Display name of the application (e.g., “Instagram”, “Safari”). Internally stored as
app_name. - Duration: Total foreground time the app was used during the observation hour, in seconds. Internally stored as
duration_sec. - Observation Start Time: Start of the hourly observation window (epoch milliseconds). Internally stored as
observation_start_time. - Notification Count: Number of notifications received from this app during the observation hour. Internally stored as
notification_count. - Pickup Count: Number of times the device was picked up to use this app during the observation hour. Internally stored as
pickup_count. - Web Domain: Website domain if the entry is for web browsing (empty for native apps). Internally stored as
web_domain. - Timezone: Device timezone at the time of capture (Olson ID, e.g.,
America/New_York). Internally stored astz.
Adding iOS App Usage to a Study
To use this feature, first contact our sales team and ask them to enable the iOS App Usage data source for your study. Once enabled, you can create an iOS App Usage activity. After adding the activity, open it in the activity editor to review and customize its configuration. For general guidance, see Creating Activities.
[!note]
Triggering logics must be spaced at least 2 hours apart to ensure meaningful data is captured in each session.
[!note]
Only one iOS App Usage activity can be created per study. The iOS App Usage data source must be added to the study before creating this activity.
Data Collection Behavior
iOS App Usage data is not collected continuously in the background. It uses an episodic collection model tied to the App Usage (iOS) activity. After the activity is triggered according to the researcher’s configured triggering logics and the participant opens the activity, the app generates usage reports for every completed hour from the last successful capture up to now minus 1 hour, capped at 1 month of history. Each hourly report includes all apps and websites used during that hour, sorted by duration.
Monitoring and Exporting iOS App Usage Data
Researchers can access iOS App Usage data through the Data Export page or the Activity Responses page.
[!note]
Visualization is not currently available for this data source. Use exported CSV data or Elasticsearch queries for analysis.
iOS App Usage Data Source in the Participant App
After joining a study, participants must grant Avicenna access to their Screen Time data:
- Go to the study homepage.
- Open the onboarding alert to continue the study setup.
- Tap Allow when iOS presents the Family Controls authorization prompt.
- Select at least 10 app categories from the app/category picker to monitor.
After this one-time setup:
- When the App Usage (iOS) activity is triggered, the participant receives a notification prompting them to open the activity.
- The app automatically generates hourly usage summaries for all completed hours from the last successful capture up to now minus 1 hour (up to 1 month of history). The participant sees a visual summary of each hour’s report as it is captured.
- The participant submits the captured data, which is then uploaded to the server for processing.
Participants can stop sharing data at any time through Settings > Screen Time on their device.
Troubleshooting
Android App Usage During Screen-Off Periods
Android App usage records can appear even when the screen is off or the device is locked, particularly overnight or for system/UI apps. These active intervals typically reflect background or system-level processes rather than direct user interaction.
Overlapping Android App Usage Intervals
Overlapping app usage intervals are expected behavior in Android and do not indicate a data error. Multiple apps may be reported as active simultaneously due to rapid app switching, split-screen or picture-in-picture usage, or system/UI overlays. When calculating total usage, account for overlapping intervals.